A Data Tailwind for Bike Ridership
May 31, 2019 by Melissa Crowe
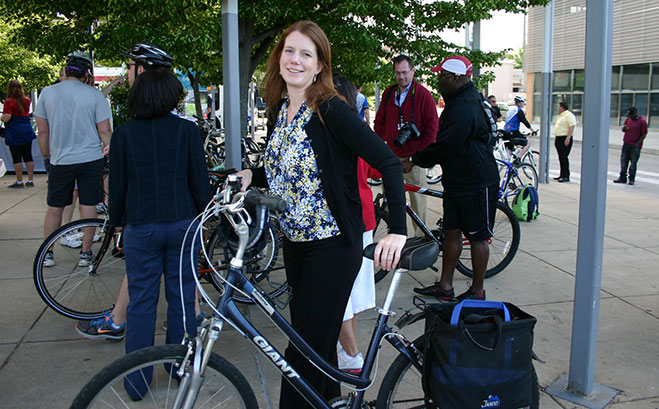
Photo credit: Montgomery County Planning Commission
All over the country, cities have made efforts to increase the use and value of their open data portals. Publishing bike ridership data is one way they've found success and brought in a new audience.
On the flipside, for cities intent on increasing bike ridership and easing traffic, the data may tell a story of how to boost ridership as well. This includes tracking the use of designated biking paths and lanes and partnering with public and private bike share programs.
"Federal highway spending on bike- and pedestrian-related improvements totaled $915.8 million this year," notes a USA Today article.
And yet, according to that article in USA Today, a survey from the U.S. Census Bureau found that the number of people commuting to work on two wheels is on the decline.
Given the close of the annual May "Bike Everywhere Month," it's an apt time to see what government data is available to answer questions around ridership.
Data for Two-Wheels
What drives people toward getting in a car, or opting for public transportation in place of a bicycle? A wide variety of factors, including the weather, the price of gas, and the safety of the streets, influence this decision.
For local governments, data shed light on ridership in two vital ways.
First, collecting data on ridership can potentially point toward resistance that could be overcome with minor changes to infrastructure or instituting new programs. Creating a distinct bike lane through a busy and central park, for instance, might have a significant impact.
Just knowing the real-time number of bike riders can help cities encourage ridership. Since 2012, Seattle has tracked the number of bikes crossing the Fremont Bridge on an hourly basis, which is updated automatically and available for use via the city's open data portal. That dataset alone has been viewed more than 17,600 times and downloaded another 23,300 times.
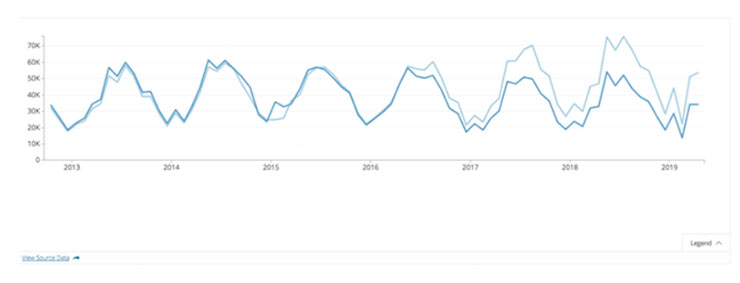
City of Seattle bike ridership on the East and West sidewalks of Fremont Bridge
Sarah Mottaghinejad, a Socrata senior curriculum designer created a data story using Socrata Perspectives based on open data from the city of Seattle.
"I've biked to work nearly every day for two years, and I'm nearly hit by vehicles all the time," Mottaghinejad says. "There's such a lack of awareness of and tolerance for bikes on our streets. I want to use data to raise awareness and make our city safer for biking."
Earlier this year, New York City began an effort counting bike usage on a single crosstown street in midtown and charting bike lanes and routes throughout the city.
In Australia, the city of Melbourne provides residents with an online map of bike share locations. Chicago offers a map of bike rack locations, while Edmonton makes planning a route easy with a map of both on and off street paths.
Bike Everywhere Month lasts for just 31 days each year. But with the data-driven launch of programs, as well as sharing data that bicyclists need to get from one side of town to another, cyclists can be more informed, and cycling can extend beyond the springtime.